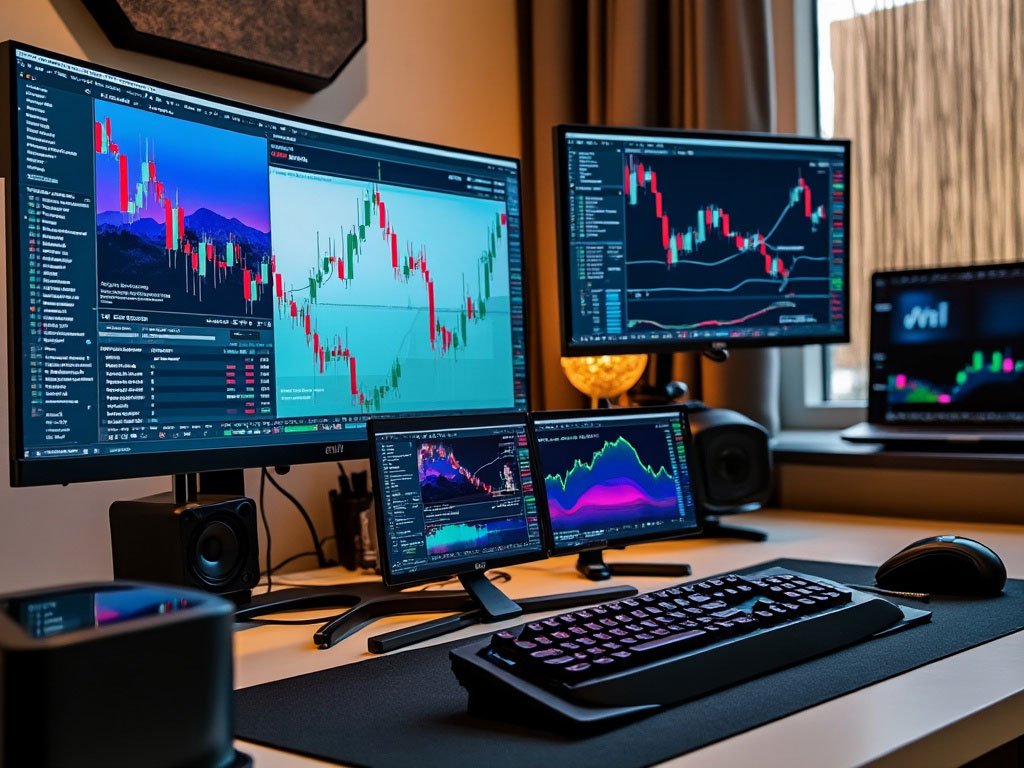
“Which chart is best for intraday trading?”
Are you doing intraday trading and can’t decide which chart is best? In today’s video, we will discuss which charts are most useful for intraday trading and how to use them correctly. So let’s get started!”
Segment 1: Why are charts important for intraday trading?
“First of all, let’s understand why charts are so important in intraday trading.
They show you real-time price movements.
You can find support and resistance levels.
It helps in deciding the right entry and exit points.
‘Charts act like your eyes and ears in trading.'”
Segment 2: Best charts for intraday trading
1. Candlestick Chart:
“Candlestick chart is the most popular and useful chart. It shows the open, high, low and close price of a stock during a certain period of time.
Green candles indicate rising prices.
Red candles indicate falling prices.
Candlestick charts help you understand patterns such as doji, hammer, and bullish engulfing.”
2. Line Chart:
“Line charts are simple and clear. It draws a line by connecting the close prices of each bar.
It is good for beginner traders.
But it does not give information about volume and patterns.”
3. Bar Chart:
“Bar charts are similar to candlestick charts, but a little more technical.
It shows the open, high, low, and close of each bar.
Professional traders prefer it.”
4. Heiken Ashi Chart:
“Heiken Ashi charts are useful for smoothing out price movements.
It helps you identify trends easily.
It minimizes false breakouts.”
5. Renko Chart:
“Renko charts are great for observing trends.
In this, the price movement is shown in the form of bricks.
It reduces noise and makes the trends clear.”
Segment 3: Which chart to use when?
“Choose the chart based on your trading style and experience:
If you are a beginner, start with a line chart.
Candlestick charts are best for understanding patterns and making better decisions.
If you want to follow smooth trends, use Heiken Ashi.”
Segment 4: Tips to read the chart correctly
Always identify support and resistance levels.
Use indicators like RSI, MACD and volume on charts.
Adjust the time frame before every trade.
Which chart is best for intraday trading?
“So friends, candlestick charts, Heiken Ashi and Renko charts are considered best for intraday trading. But choosing the right chart depends on your trading style and needs.
Which chart is best for intraday trading?
If you found this blog informative, share it. And yes, comment below which charts you use. See you next time with new information. Which chart is best for intraday trading?
Till then… Trade smartly and make profits!”
Which chart is best for intraday trading?

