Top Excel Techniques for Financial Analysis
Hello friends! Do you want to make financial analysis in Excel easy and fast? If yes, then today’s blog is for you! In this blog, we will learn about some of the best tricks of Excel, which will take your finance and data analysis skills to the next level. So let’s get started!
2: Data Cleaning Tricks (Data Formatting & Validation)
For financial analysis, first of all it is important that the data is clean and correct. Let’s know some important tricks!
✅ Remove Duplicates – To remove duplicate entries in data
📌 Shortcut: Select Data → Data Tab → Remove Duplicates
✅ Text to Columns – To divide the data of one column into different columns
📌 Shortcut: Select Column → Data Tab → Text to Columns
✅ Data Validation – To prevent wrong entries
📌 Shortcut: Select Cells → Data Tab → Data Validation → Set Rules
If your data is clean and organized, financial analysis will become even easier! Top Excel Techniques for Financial Analysis
3: Financial Formula Tricks
Now let’s know some important financial formulas, which every Excel user should know!
✅ NPV (Net Present Value) – To calculate the present value of an investment
📌 Formula: =NPV(discount_rate, cash_flows)
✅ IRR (Internal Rate of Return) – To calculate the estimated return of an investment
📌 Formula: =IRR(cash_flows)
✅ PV (Present Value) – To calculate the present value of a future cash flow
📌 *Formula: =PV(rate, nper, pmt, [fv]) *
✅ FV (Future Value) – How much the investment will be worth in the future
📌 Formula: =FV(rate, nper, pmt, [pv])
These formulas will help you in making investment and financial decisions! Top Excel Techniques for Financial Analysis
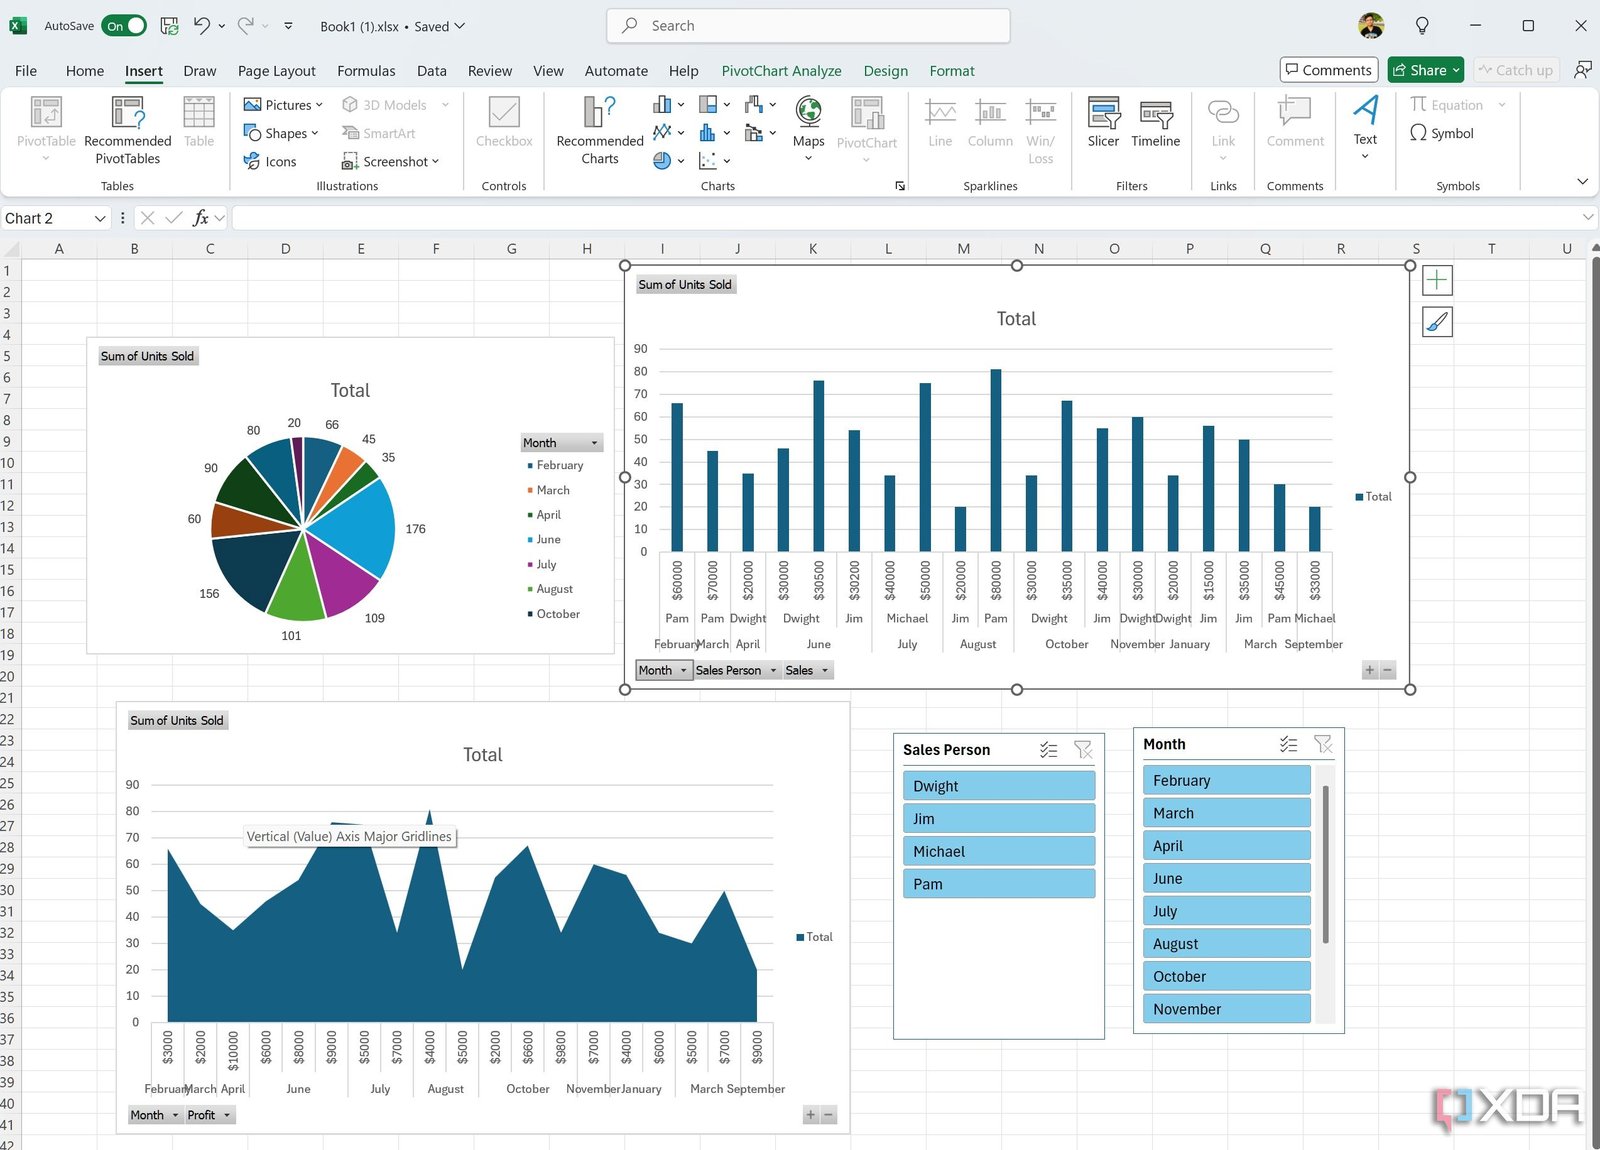
4: Pivot Table – The easiest way to analyze data
If you have a lot of data and want to analyze it quickly, then there is nothing better than a Pivot Table!

✅ How to insert a Pivot Table
📌 Shortcut: Select Data → Insert Tab → Pivot Table
✅ Quick Analysis Pivot Table
📌 Data → Quick Analysis → Pivot Table
With Pivot Table, you can create reports and filter data in just one click! Top Excel Techniques for Financial Analysis
5: What-If Analysis & Goal Seek
Do you want to know what will be the effect of changing a financial plan? Excel’s ‘What-If Analysis’ tool can help you in this task!
✅ Goal Seek: – Know which inputs you need to change to get a particular result
📌 Shortcut: Data Tab → What-If Analysis → Goal Seek
✅ Data Table: – Compare different scenarios
📌 Shortcut: Data Tab → What-If Analysis → Data Table
If you are doing investment or budget planning, then these tricks are very useful for you! Top Excel Techniques for Financial Analysis
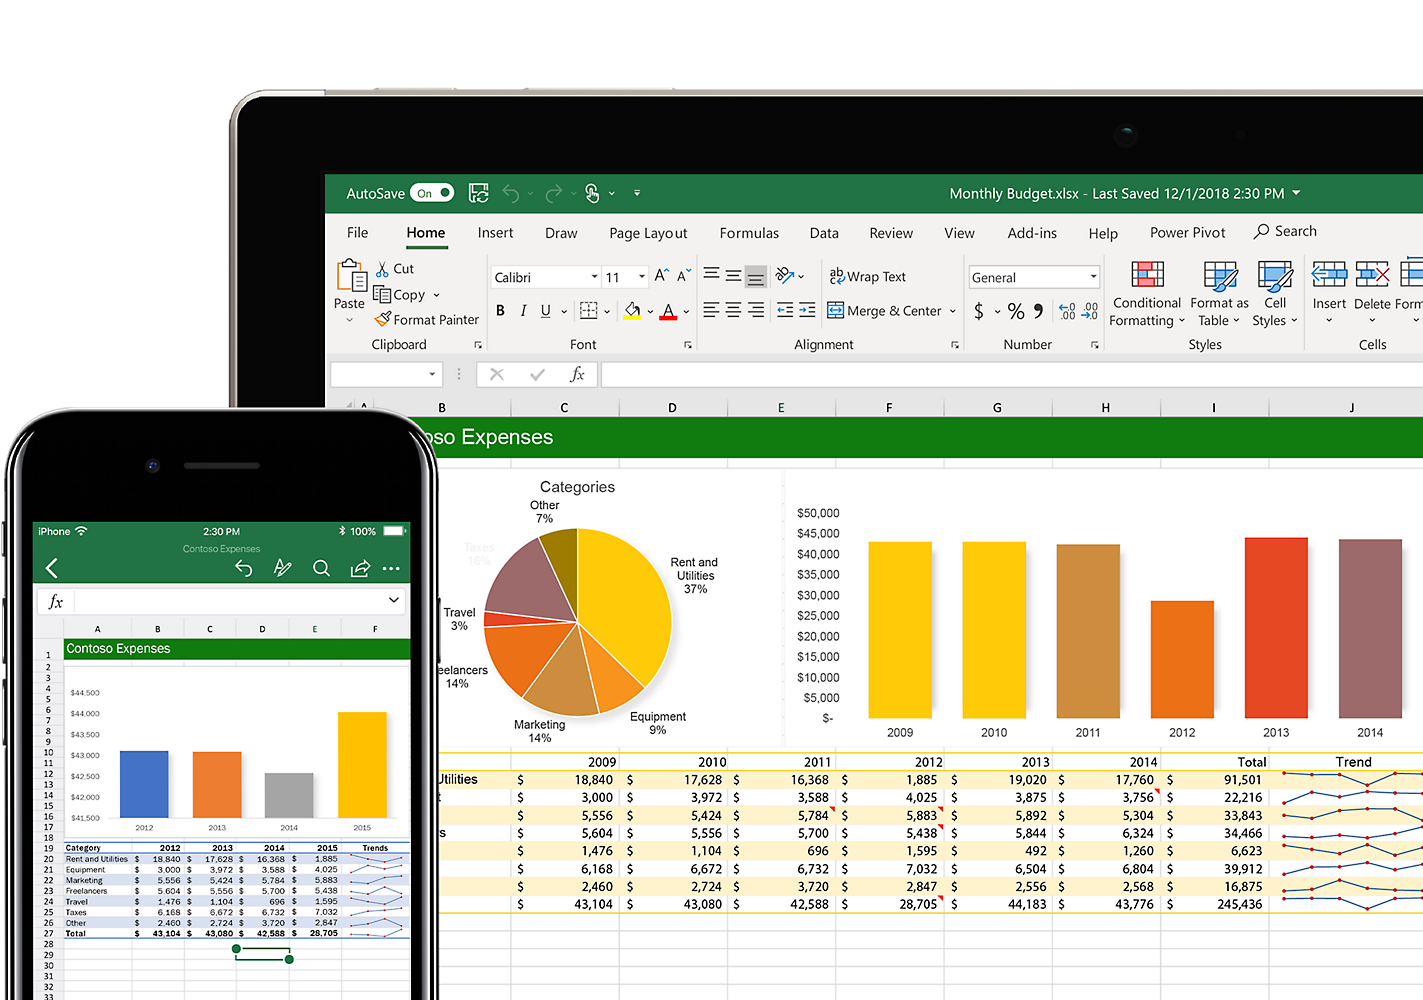
6: Data Visualization Tricks (Charts & Conditional Formatting)
Understanding and presenting data is as important as analyzing it. Let’s know some great visualization tricks!
✅ Sparklines: – To show a data trend in a small graphic line
📌 Shortcut: Select Cells → Insert Tab → Sparklines
✅ Conditional Formatting: – To highlight data through colors
📌 Shortcut: Select Data → Home Tab → Conditional Formatting
✅ Best Charts for Financial Analysis:
📌 Line Chart: To show the trend of data over time
📌 Column Chart: For comparison in different categories
📌 Pie Chart: To show data in percentage form
If you create financial reports, then it is very important to show the data in visual form.

7: Advanced Excel Tricks – Power Query & Macros
Now let’s know some advanced Excel tricks, which can supercharge your financial analysis!
✅ Power Query: – To connect and clean different data sources
📌 Shortcut: Data Tab → Get & Transform → Power Query
✅ Macros: – To automate repeated tasks
📌 Shortcut: View Tab → Macros → Record Macro
Power Query and Macros can automate your Excel work and make it much faster! Top Excel Techniques for Financial Analysis
8: Conclusion & Call to Action
So friends, these were the best tricks of Excel, which are very important for financial analysis. Did you already know any of these tricks? Do tell us in the comments!
🔹 If you liked the blog, then share it.
🔹 Press the bell icon to see more blogs related to Excel and finance.
See you in the next blog, until then… Happy Learning! 🚀
Top Excel Techniques for Financial Analysis